Customer journey maps are a representation of the experience a person has as they go through a process or try to complete a task. A journey map shows their actions, thoughts, questions and emotions and how they change at each stage.
They’re a common artefact for customer experience (CX) and user experience (UX) teams, who use them to help guide the design of better products, processes and digital experiences. But why should they have all the fun? Journey maps are a brilliant tool for content professionals too.
Great content is about getting the right message to the right person at the right time, right? So having a map of what your users are thinking, feeling and doing is an invaluable tool to help with that task. What’s more, they can help you join up your content across different channels, online and offline and organisational silosto create a better experience.
Avoid ‘funnel thinking’: Map your way to clarity
The advantage of customer journey maps for content is that they can help you untangle a host of knotty insights and ideas into a neat, organised, actionable artefact.
There’s so much data and insight available to us about what our users need, what they want and what they’re interested in. You might have access to:
A set of personas
Customer surveys
CRM data
Analytics
Social stats
As well as the above, you may also have requests from your colleagues or stakeholders for the content they want to help with their objectives.
It can quickly become like a long ‘to-do’ list of topics, and the context behind them can get lost.
The closest many organisations get to looking at the context and end-to-end journey their users go on is using the ‘funnel’ model, and in turn thinking about ‘upper funnel’ vs ‘lower funnel’ content. The issue with this is that the funnel isn’t a customer-centric or empathetic way of looking at things. That’s because:
It’s too linear to reflect real user behaviour
It’s too sales-focused to be empathetic and, crucially;
It ignores what happens after the customer buys/signs-up (or whatever your goal is).
A diagram conveying the classic ‘full-funnel’ marketing approach, using the stages Awareness, Consideration and Conversion
‘Funnel thinking’ also misses two big opportunities:
1. Understanding the wider context: Why your customer does the things they do, so you can create content in response.
2. Supporting the customer after they make a purchase or interact with your brand: So that you can give them a better experience and create loyalty and advocacy.
‘Journey thinking’ will allow you to take a complex set of insights and codify them enough to be actionable.
Better still, maps turn those insights into a narrative (and what do us content people love more than a narrative?!), which makes them easier to process and understand.
Create a set of journey maps for key user journeys, and you’ll have the ideal tool for spotting opportunities and prioritising what content to create.
How to make customer journey maps: 10+ important questions to ask colleagues and customers
To make your maps, the first thing you need to do is choose the journeys you want to represent. What these are will depend on your organisation, your goals and your customers.
Try to choose journeys that involve a shared goal between you and your customer.
For example, if you worked for a car insurance company, a good journey to map might be a young driver getting insurance for the first time. The driver’s goal might be to buy a car and get on the road and - while your map should acknowledge that - there’s no point going into a lot of depth on that whole journey when not all the steps involve your brand.
The second thing you need to do is carry out your research and gather your insights. Perhaps the most useful thing to do is speak to some of your users.
Your interviews can be face-to-face or over the phone, and should focus on finding out about their journey at a granular level. Ask them about:
Their goal when they started out
Where they looked for information online
Who they spoke to in real-life
What search terms they used
If they compared different options
What device they were using
Where they were when they used it
How they felt
What was easy
What was hard
What questions they had
As well as customer interviews speak to your colleagues, especially anyone who interacts with customers regularly. Ask them:
What they know about the stages customers go through on their way to making a purchase (or whatever else your goals is)
What complaints or pain points they might have heard about
There’s also a host of data that you can look at too:
Google Analytics : look at demographics, location, device, behaviour, interests for your website users and more. Multi-channel funnels are great to understand how people switch between channels
Buzzsumo: find the most shared content on a topic/from a website
Tools like FollowerWonk and Social Mention: research common terms, hashtags, links, help you explore users, etc
Reddit : get an insight on certain topics, opinions and questions
Quora: see the questions people are asking, as well as the answers other people are giving
Google Trends : discover how popular certain search terms are over time, related topics, etc
Answer The Public: get insights on what questions people are asking via search, and how they feel about those topics
"Customer journey mapping is a way to bring disparate sets of data into one place, to produce a story that’s based on emotion but backed by numbers."
How to map a customer journey using collected insights
Once you’ve gathered together all your information, data and intel, it’s time to map them to the customer journey. But before you can do that, you need to work out how you will lay out your map. You need to think about your x and y axis:
X axis or journey phases: this could be something like McKinsey’s, where you keep the stages brand-focused, e.g. ‘awareness’, ‘consideration’, ‘evaluation’, ‘buy’, ‘bond’, ‘advocacy’ -or, something 100% customer-led, e.g. ‘trigger’, ‘research’, ‘compare’, ‘buy’, ‘use’, ‘share’. Whatever you choose, make sure it reflects the phases your user goes through and that you don’t end with ‘buy’ - because there’s always at least one more step.
Y axis or journey facets: this is where you break down what’s happening at that stage of the journey. At its simplest, this could just be something like ‘thinking’, ‘feeling’, and ‘doing’. You can add lots more facets, depending on the data and insights you have available, for example: activities, channels, touch points, experience, anything goals related, questions etc. Anything that you find useful for inspiring content.
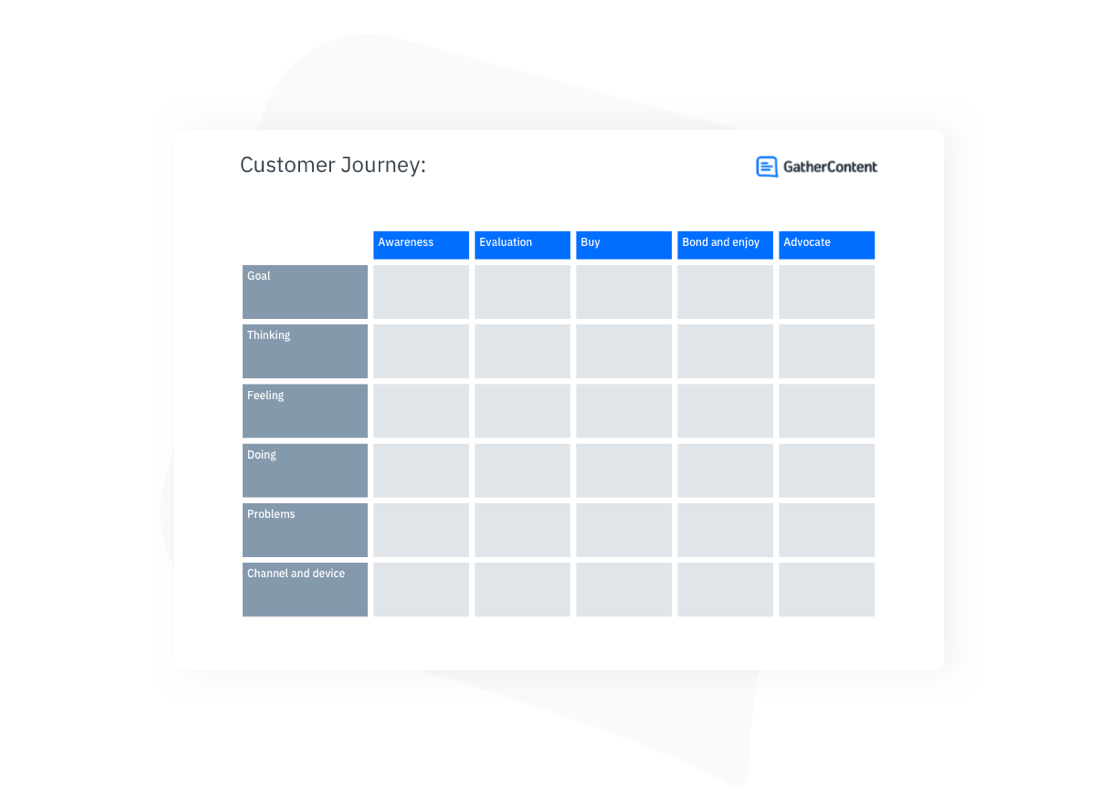
Good to know: We’ve made an easy-to-use journey mapping template that you can download now to help you get started.
As you map your insights to your x and y axis, be realistic and remember to look at the customer’s entire world.
A real journey will almost never focus just on your brand, so if your customer journey map does this, you might be missing something.
There’s always outside influences at play - competitors, review sites, friends, family, newspapers - make sure you capture them. Thinking back to our car insurance example, our young driver probably won’t immediately think of one brand, read their content and then buy their insurance. They’ll probably get advice from a parent or a friend, ask for recommendations, or use a comparison or consumer advice service.
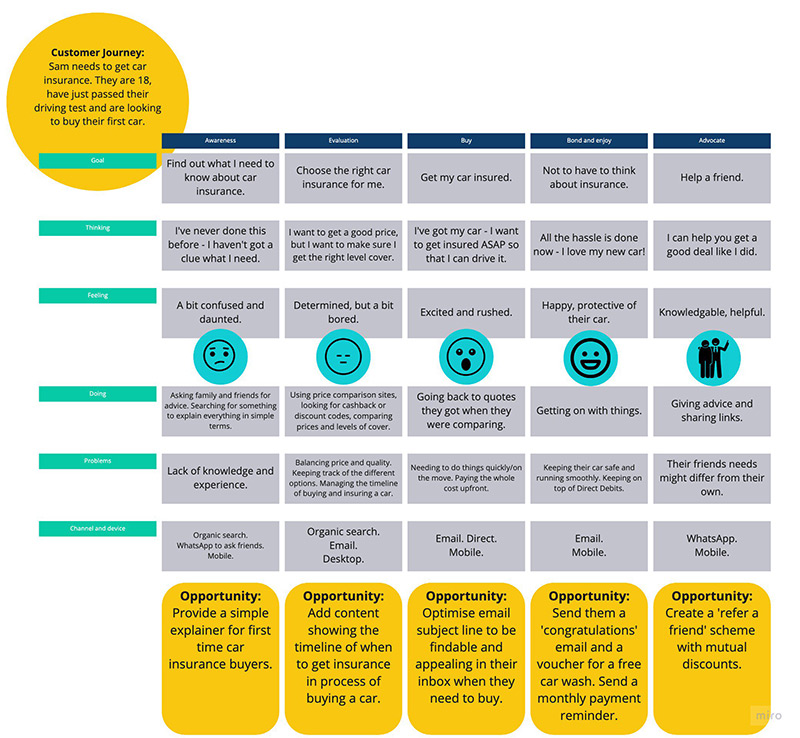
Here's a completed user journey map using our template and the car insurance example:
An example of a fully completed customer journey map
"It’s important to remember your customers are solving a problem. That means they’re probably feeling some emotion — whether that is relief, happiness, excitement, or worry. Adding these emotions to the journey map can help you mitigate negative emotions about the journey so that they don’t become negative opinions about your brand."
Making the most of your customer journey maps: Keep them visible
So now you have your maps, you need to use them. They are brilliant assets for planning; studying the map should throw up plenty of gaps, pain points and opportunities where you can add new content, refine existing content, start using a new channel or tweak how you’re using an old one.
Connecting the gaps and opportunities you spot to your KPIs can help you prioritise activities based on impact. For example, if your customer lifetime value is dropping, you could consult the map and look at what’s happening post-purchase and prioritise the opportunities that lie there.
It’s a good idea to print your journey maps out and stick them on the wall (wherever you’re working right now) - that way, they’ll always be in your line of sight to act as a reminder and inspiration. Make a diary note to refresh it with new data and insights on a regular basis. Customers and their habits change and, of course, your efforts will affect what their journey looks like too.
These print-outs can be great conversation starters too. Because they’re customer-focused and channel and platform agnostic, your colleagues and stakeholders could see insight and ideas that interest them and relate to their area of work. You might find that having a big, beautiful map out on display can help open lines of conversation and get collaboration started.
Customer journey maps are a representation of the experience a person has as they go through a process or try to complete a task. A journey map shows their actions, thoughts, questions and emotions and how they change at each stage.
They’re a common artefact for customer experience (CX) and user experience (UX) teams, who use them to help guide the design of better products, processes and digital experiences. But why should they have all the fun? Journey maps are a brilliant tool for content professionals too.
Great content is about getting the right message to the right person at the right time, right? So having a map of what your users are thinking, feeling and doing is an invaluable tool to help with that task. What’s more, they can help you join up your content across different channels, online and offline and organisational silosto create a better experience.
Avoid ‘funnel thinking’: Map your way to clarity
The advantage of customer journey maps for content is that they can help you untangle a host of knotty insights and ideas into a neat, organised, actionable artefact.
There’s so much data and insight available to us about what our users need, what they want and what they’re interested in. You might have access to:
A set of personas
Customer surveys
CRM data
Analytics
Social stats
As well as the above, you may also have requests from your colleagues or stakeholders for the content they want to help with their objectives.
It can quickly become like a long ‘to-do’ list of topics, and the context behind them can get lost.
The closest many organisations get to looking at the context and end-to-end journey their users go on is using the ‘funnel’ model, and in turn thinking about ‘upper funnel’ vs ‘lower funnel’ content. The issue with this is that the funnel isn’t a customer-centric or empathetic way of looking at things. That’s because:
It’s too linear to reflect real user behaviour
It’s too sales-focused to be empathetic and, crucially;
It ignores what happens after the customer buys/signs-up (or whatever your goal is).
A diagram conveying the classic ‘full-funnel’ marketing approach, using the stages Awareness, Consideration and Conversion
‘Funnel thinking’ also misses two big opportunities:
1. Understanding the wider context: Why your customer does the things they do, so you can create content in response.
2. Supporting the customer after they make a purchase or interact with your brand: So that you can give them a better experience and create loyalty and advocacy.
‘Journey thinking’ will allow you to take a complex set of insights and codify them enough to be actionable.
Better still, maps turn those insights into a narrative (and what do us content people love more than a narrative?!), which makes them easier to process and understand.
Create a set of journey maps for key user journeys, and you’ll have the ideal tool for spotting opportunities and prioritising what content to create.
How to make customer journey maps: 10+ important questions to ask colleagues and customers
To make your maps, the first thing you need to do is choose the journeys you want to represent. What these are will depend on your organisation, your goals and your customers.
Try to choose journeys that involve a shared goal between you and your customer.
For example, if you worked for a car insurance company, a good journey to map might be a young driver getting insurance for the first time. The driver’s goal might be to buy a car and get on the road and - while your map should acknowledge that - there’s no point going into a lot of depth on that whole journey when not all the steps involve your brand.
The second thing you need to do is carry out your research and gather your insights. Perhaps the most useful thing to do is speak to some of your users.
Your interviews can be face-to-face or over the phone, and should focus on finding out about their journey at a granular level. Ask them about:
Their goal when they started out
Where they looked for information online
Who they spoke to in real-life
What search terms they used
If they compared different options
What device they were using
Where they were when they used it
How they felt
What was easy
What was hard
What questions they had
As well as customer interviews speak to your colleagues, especially anyone who interacts with customers regularly. Ask them:
What they know about the stages customers go through on their way to making a purchase (or whatever else your goals is)
What complaints or pain points they might have heard about
There’s also a host of data that you can look at too:
Google Analytics : look at demographics, location, device, behaviour, interests for your website users and more. Multi-channel funnels are great to understand how people switch between channels
Buzzsumo: find the most shared content on a topic/from a website
Tools like FollowerWonk and Social Mention: research common terms, hashtags, links, help you explore users, etc
Reddit : get an insight on certain topics, opinions and questions
Quora: see the questions people are asking, as well as the answers other people are giving
Google Trends : discover how popular certain search terms are over time, related topics, etc
Answer The Public: get insights on what questions people are asking via search, and how they feel about those topics
"Customer journey mapping is a way to bring disparate sets of data into one place, to produce a story that’s based on emotion but backed by numbers."
How to map a customer journey using collected insights
Once you’ve gathered together all your information, data and intel, it’s time to map them to the customer journey. But before you can do that, you need to work out how you will lay out your map. You need to think about your x and y axis:
X axis or journey phases: this could be something like McKinsey’s, where you keep the stages brand-focused, e.g. ‘awareness’, ‘consideration’, ‘evaluation’, ‘buy’, ‘bond’, ‘advocacy’ -or, something 100% customer-led, e.g. ‘trigger’, ‘research’, ‘compare’, ‘buy’, ‘use’, ‘share’. Whatever you choose, make sure it reflects the phases your user goes through and that you don’t end with ‘buy’ - because there’s always at least one more step.
Y axis or journey facets: this is where you break down what’s happening at that stage of the journey. At its simplest, this could just be something like ‘thinking’, ‘feeling’, and ‘doing’. You can add lots more facets, depending on the data and insights you have available, for example: activities, channels, touch points, experience, anything goals related, questions etc. Anything that you find useful for inspiring content.
Good to know: We’ve made an easy-to-use journey mapping template that you can download now to help you get started.
As you map your insights to your x and y axis, be realistic and remember to look at the customer’s entire world.
A real journey will almost never focus just on your brand, so if your customer journey map does this, you might be missing something.
There’s always outside influences at play - competitors, review sites, friends, family, newspapers - make sure you capture them. Thinking back to our car insurance example, our young driver probably won’t immediately think of one brand, read their content and then buy their insurance. They’ll probably get advice from a parent or a friend, ask for recommendations, or use a comparison or consumer advice service.
Here's a completed user journey map using our template and the car insurance example:
An example of a fully completed customer journey map
"It’s important to remember your customers are solving a problem. That means they’re probably feeling some emotion — whether that is relief, happiness, excitement, or worry. Adding these emotions to the journey map can help you mitigate negative emotions about the journey so that they don’t become negative opinions about your brand."
Making the most of your customer journey maps: Keep them visible
So now you have your maps, you need to use them. They are brilliant assets for planning; studying the map should throw up plenty of gaps, pain points and opportunities where you can add new content, refine existing content, start using a new channel or tweak how you’re using an old one.
Connecting the gaps and opportunities you spot to your KPIs can help you prioritise activities based on impact. For example, if your customer lifetime value is dropping, you could consult the map and look at what’s happening post-purchase and prioritise the opportunities that lie there.
It’s a good idea to print your journey maps out and stick them on the wall (wherever you’re working right now) - that way, they’ll always be in your line of sight to act as a reminder and inspiration. Make a diary note to refresh it with new data and insights on a regular basis. Customers and their habits change and, of course, your efforts will affect what their journey looks like too.
These print-outs can be great conversation starters too. Because they’re customer-focused and channel and platform agnostic, your colleagues and stakeholders could see insight and ideas that interest them and relate to their area of work. You might find that having a big, beautiful map out on display can help open lines of conversation and get collaboration started.
Lauren is a freelance content strategy and digital transformation consultant, working with organisations that make the world a better, fairer, more beautiful place.
Lauren has been working in content and digital since way back in 2007 and since then has worked with some of the world’s biggest brands, including adidas, American Express, Microsoft and Tetra Pak.
She lives in Brighton, and loves the Downs, the sea, dystopian fiction and bold lipstick.